Voir la page en français

Differential RNA-seq analysis at a base pair-resolution

DiffSegR: an RNA-seq data driven method for differential expression analysis using changepoint detection

To fully understand gene regulation, it is necessary to have a thorough understanding of both the transcriptome and the enzymatic and RNA-binding activities that shape it. While many RNA-Seq-based tools have been developed to analyze the transcriptome, most of them only consider the abundance of sequencing reads along annotated patterns (such as genes). These annotations are typically incomplete, leading to errors in differential expression analyses.

To address this question the OGE and GNET team from IPS2, with the support Phenoscope, the POPS platform and the LaMME, published in NAR Genomics and Bioinformatics DiffSegR, an R package that enables the discovery of transcriptome-wide expression differences between two biological conditions using RNA-Seq data. DiffSegR does not require prior annotations and uses a multiple changepoints detection algorithm to identify the boundaries of differentially expressed regions based on the per-base log2 fold change. In a few minutes of computation, DiffSegR could rightfully predict the role of chloroplast ribonuclease Mini-III in rRNA maturation and chloroplast ribonuclease PNPase in the 3′ or 5′ degradation of rRNA, mRNA, tRNA precursors, and spliced introns. We believe that DiffSegR will benefit biologists working on transcriptomics as it allows access to information from a layer of the transcriptome overlooked by classical differential expression analysis pipelines widely used today. DiffSegR is available at https://aliehrmann.github.io/DiffSegR/index.html.
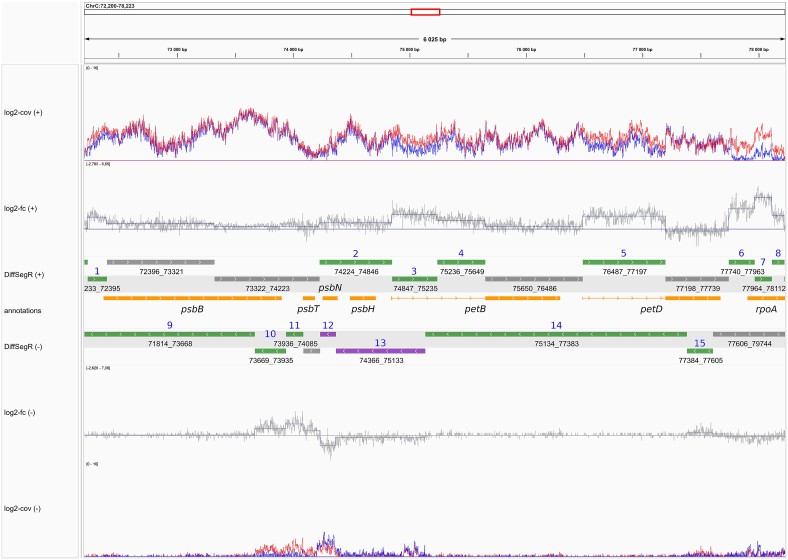
Analysis of the psbB-psbT-psbN-psbH-petB-petD gene cluster in the ribonuclease PNPase pnp1-1 mutant dataset. The tracks from top to bottom represent: (log2-Cov (+)) the mean of coverages on the log2 scale for the forward strand in both biological conditions of interest, with the blue line representing the Wild-Type (WT) condition and the red line representing the pnp1-1 mutant for the chloroplast (pnp1-1); (log2-FC (+)) the per-base log2-FC between pnp1-1 (numerator) and WT (denominator) for the forward strand. The changepoint positions are indicated by vertical blue lines, and the mean of each segment is shown by horizontal blue lines; (DiffSegR (+)) the differential expression analysis results for segments identified by DiffSegR on the forward strand are presented as follows: up-regulated regions are depicted in green, down-regulated regions in purple, and non-differentially expressed regions in gray; (annotations) genome annotations provided by the. Symmetrically, the remaining tracks correspond to the same data on the reverse strand.

11/03/2024